PowerScribe Troubleshooting
To move most issues forward that require deep analysis, the initial step for ALL troubleshooting of PowerScribe issues should begin by enabling and gathering the logs generated by the desktop client.
Log files will be required for any escalation, as they are essential for identifying issues.
These articles will explain what sections of the SPortal Excel document to review for common PowerScribe issues. Should your issue not show in these log files, you should escalate the issue to a lead for further review.
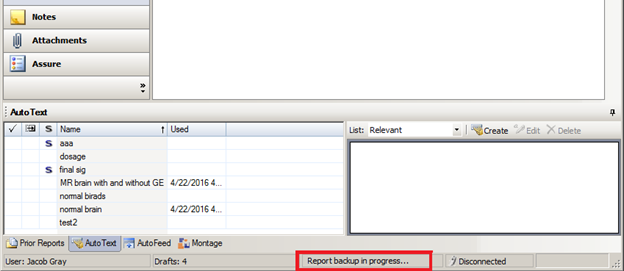
While dictating, the client application locks up with the toolbar saying Report backup in progress.
This is sometimes referred to by customers as the blue spinning wheel, as during this time, the client is unresponsive or “locked up”.
This can be caused by Dragon generating and compressing audio which is used during report recovery after an application crash.
However, depending on the customer’s environment, this backup can cause problems for end users. It’s commonly negatively affected by antivirus and potentially encryption software.
You can disable the backup process by making the following changes:
Please Note: Disabling this setting will only remove audio in the event of a reported crash, assuming the report that the users are working on have met the criteria to be backed-up, which is heavily user workflow dependent, the report text would still be available.
Login latency can be classified as the time it takes to launch/login to the client. Our logs currently measure the time from when the client displays to the time the login completes. This does NOT include the time it takes to launch the client and verify/download the software.
Report open latency is described as any latency seen when a user attempts to open a report in the PowerScribe client with several potential culprits and contributing factors. Review the relevant sections of the Excel document for understanding and next steps.
Latency on report open can be a perception issue. If you’ve reviewed the above Excel tabs, the latency on report open may be related to a latency getting the command from PACS. If this is the case, you may need to engage the PACS vendor.
Report close latency is described as any latency seen when a user attempts to close a report in the PowerScribe client with several potential culprits and contributing factors. Review the relevant sections of the Excel document for understanding and next steps.
Latency on report close can be a perception issue. If you’ve reviewed the above Excel tabs, the latency on report close may be related to a latency closing images in PACS after we’ve sent the notification, and you may need to involve the PACS vendor.
Slowness transcribing text is a large delay in the time it takes for a user to dictate and have the text appear on screen for radiologist users. This would not cover delays making keyboard edits by editor users.
Recognition happens in memory, which makes it susceptible to interference from antivirus. Specific applications that have caused issues:
| 3rd Party Software | Dragon Version | PS Version |
| Carbon Black | 12.54.150.123 | 4.0 |
Slowness tabbing through fields is described as a large delay in the time it takes for a user cursor to move from one field in the AutoText to the next field.
Tabbing through fields involves changing context in Dragon, which happens in memory. This makes it potentially susceptible to interference from antivirus. Specific applications that have caused issues:
| 3rd Party Software | Dragon Version | PS Version |
| Carbon Black | 12.54.150.123 | 4.0 |
Slowness turning the microphone on can have a few root causes. It’s measured as how long it takes for the user to press the microphone button to the time the microphone turns on.
Slowness turning the microphone on can have a few root causes. It is measured by how long it takes for the user to press the microphone button to the time the microphone turns on.
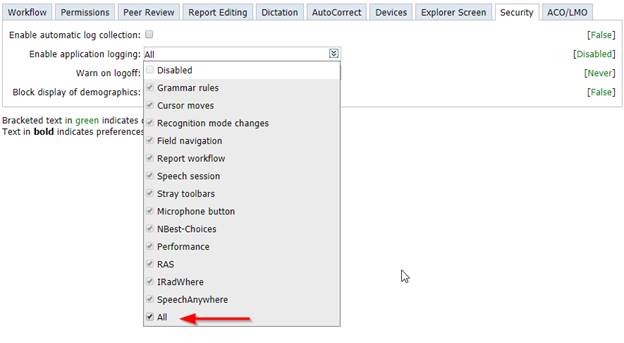
To enable PowerScribe application logging at the user or system level:
Performance Logs:
Enabling performance logging requires editing the Windows Registry. To do so, you must log in with administrative privileges on the client workstation.
For 64bit workstations, download and run the following file:
EnablePerformanceLogging_x64.reg Sandra, File#1
For 32bit workstations, download and run the following file:
EnablePerformanceLogging_x86.reg Sandra, File#2
There should not be any performance degradation by enabling this logging, and if there is, it could be indicative of the issues you are troubleshooting.
| Log Type | Log Location |
| App | C:\Users\Username\AppData\Local\Nuance\PowerScribe*\Logs\App |
| Bandwidth | C:\Users\Username\AppData\Local\Nuance\PowerScribe*\Logs\Bandwidth |
| Dragon | C:\Users\Username\AppData\Roaming\Nuance\Dragon SDK Client Edition12 |
| Environmental | C:\Users\Username\AppData\Local\Nuance\PowerScribe*\Logs\Env |
| PACS | C:\Users\Username\AppData\Local\Nuance\PowerScribe*\Logs\PACS |
| Perf | C:\Users\Username\AppData\Local\Nuance\PowerScribe*\Logs\Perf |
| RAS | C:\Users\Username\AppData\Local\Nuance\PowerScribe*\Logs\RAS |
| PS360Error | C:\Users\Username\AppData\Local\Nuance\PowerScribe*\Logs\ |
| ShutDownLog | C:\Users\Username\AppData\Local\Nuance\PowerScribe*\Logs\ |
These logs contain in depth information about various PowerScribe client activities.
This log will have any results of the Bandwidth test in 4.0 and above.
The Dragon log is generated by the Natspeak.exe process that is initialized when a user logs in with speech enabled.
You can enable additional deeper logging depending on the issue.
| Name | Description |
How to Enable |
| NBest-Choices | Enables recognition events in the Dragon log. This should only be done on 3.5.x versions and lower. In 4.0, this can be enabled as part of the application logging | In the C:\ProgramData\Nuance\Dragon SDK
Client Edition12\natspeak.ini,
add the following lines (case sensitive): [Tracing] NBest-Choices=1 |
| NatSDK COM Calls | This enables deeper logging with Dragon to get better stack traces to understand issues/crashes | In the C:\ProgramData\Nuance\Dragon SDK
Client Edition12\nssystem.ini,
add the following lines (case sensitive) to the [Tracing] section:
NatSDK COM Calls=1 |
| PowerMic Events | This enables microphone button press logging within the Dragon log. This should only be done on 3.0.x and lower versions of PowerScribe. | In the C:\ProgramData\Nuance\Dragon SDK
Client Edition12\nssystem.ini,
add the following lines (case sensitive) to the [Tracing] section:
PowerMic Events=1 |
When the client is launched, it performs a general health check of the workstation, looking to ensure it is setup close to our recommendations from the client installation document.
PACS logs are frequently located in the %localappdata%\Nuance\PowerScribe*\Logs\PACS folder, but versions 2.5 and lower may be in %temp% instead.
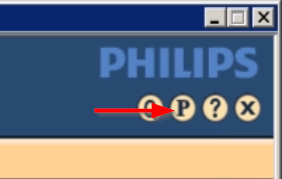
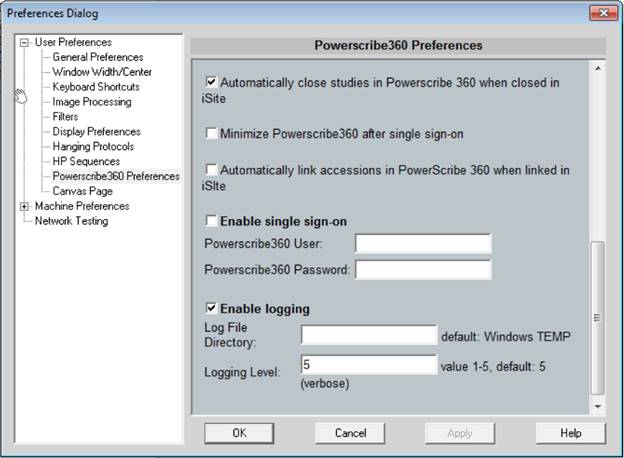
The iSite/Intellispace plugin is written and developed by Nuance. There is additional logging available to help troubleshoot this integration.
To enable this logging:
Mesaures launching, login, and report open/close events in the client
Measures how long web requests to the server take to complete. Available in 3.0 and higher
Contains any errors that cannot be sent to th RAS server (in the event the app/DB server(s) are down
If the client is closed in an irregular way (an unexpected error for instance), that error will be logged here.
In 2.0.x and lower, you must manually collect these logs from the workstation. Review the log table to identify the location.
In 2.5.x and higher, you can collect these logs by having the user use the Help>Collect Logs feature.
Sandra, insert image 2019-11-27 11_53_23-.png
In 3.x or higher, they can be collected automatically by setting the RadPortal>Setup>Account or System>Preferences>Security>Enable Automatic Log Collection to true
Sandra, insert image 2019-11-27 11_55_55-Nuance PowerScribe® 360 _ Reporting_ Account Preferences.png
When these logs are uploaded, they will be uploaded to the X:\Nuance\FileUploader folder. If you're unsure of the folder location, you can open the C:\inetpub\wwwroot\PS360FileUploaderService\web.config file and look for the storagePath variable:
Sandra, insert image 2019-11-27 12_13_21.png
When a user has a recognition issue, or latency transcribing text, hearing the audio from the workstation is sometimes useful. While the report is OPEN (this option is not present when a report is closed),
you can have the user go to Help > Report Dictation Problem.
Sandra, insert image 2019-11-27 12_17_22-.png
This will upload a folder to X:\Nuance\DragonUsers\PS360_Debug\Username_ReportID (with the reportID being the database reportID value). Inside will be a copy of the voice profile, as well as the Username_ReportID.dra file and Username_ReportID.txt file.
The .txt will contain the note the user included when uploading the problem, and the DRA file can be loaded into the C:\Program Files (x86)\Nuance\Dragon SDK Client Edition12\SDK\samples\activex\cs\dictcust.exe program on any workstation with
PowerScribe/Dragon installed for playback.
After logs have been gathered, you can upload the entire zip folder to http://mlb-sportal.nuance.com/Log/Application, which will return an Excel spreadsheet for review. The following tabs should be available if the noted required logs are provided.
The data in this tab is pulled directly out of the PowerScribe app logs and made more human readable. The contents are used in the creation of multiple other tabs, making it so the data contained in here is typically used for just deep analysis.
The data in this tab will change depending on PS360 version, as new logging (like IRadWhere, and MicrophoneButton) have been added in newer releases to help with troubleshooting.
Much of the data in the tab is abstract and useful to development, but some of it can be used filtered to deep dive into other issues, like microphone button presses and integration events. These types of events correlate to the MicrophoneButton and IRadWhere log types.
The IRadWhere logging is the lowest level of integration logging available, and is the only way to see integration events from a PACS integration build on the IRadWhere API connection.
To see these specifically, on the LogType column, you can click the down arrow and filter to these event types:
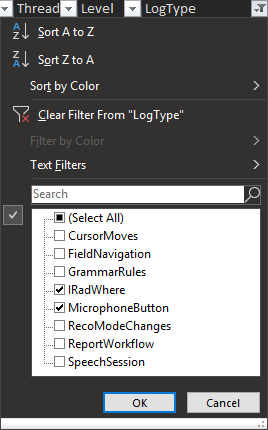
Which will give you a result like this:
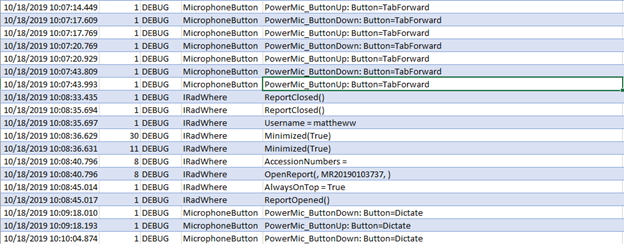
Using just these two log types, you can get a good understanding of the user’s workflow.
Generating audio can introduce latency at various points of the workflow. This tab will show you when audio is being generated, what type of audio, and how long it took.
This type of audio is generated WHILE the user has a report open.
To disable this process, see the Common IssuesReport Backup in Process section.
This type of audio is generated at report approve (resident) and sign (attending). This is the audio created for ACO/LMO.
To disable, you can uncheck the Enable Dragon data collection preference:
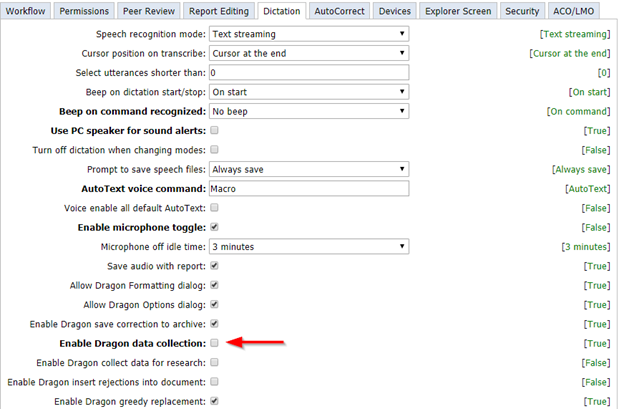
PLEASE NOTE: Disabling the preference will stop ACO/LMO from running for the user.
This type of audio is generated when a report is closed. It is the audio that is available for download in RadPortal
![]()
To disable, uncheck the Save audio with report preference:
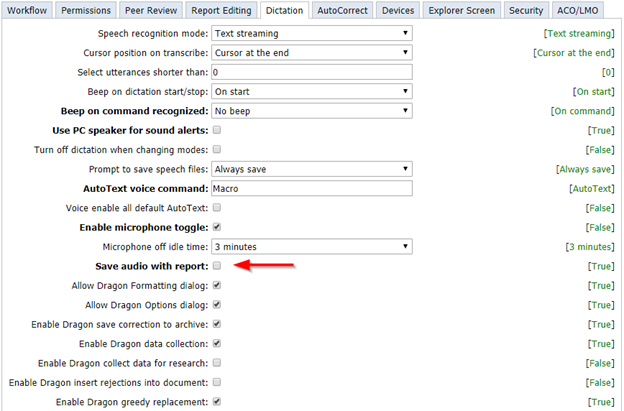
PLEASE NOTE: When disabling this preference, audio is only preserved at report close when the user sends a report to editor (Correct Report). Under all other workflows (draft, prelim, sign), audio will be discarded and unavailable when the report is reopened, even if the user then chooses to send the report to editor.
For sites without editors and sites that don’t audit the audio files, this can be turned off safely without user impact.
Latency generating audio can be exacerbated by local software, such as AV, anti-malware, or disk encryption software.
Should this happen, ensure the customer has proper exclusions in place for ALL of these apps. You may need a review of the local applications to determine what each are and whether they have/need exclusions.
The field navigation tab shows the time it takes for the user to press the tab button to the time the cursor moves in the client.
The IsRecognizing column displays whether or not Dragon was attempting to perform a recognition at the time the user pressed the button. If this is true, the cursor will not move to the next field until the recognition is complete. Review the Recognition Events tab for more details.
This tab looks exclusively for microphone-initiated field navigation changes. Voice commands for changing fields (Next Field, Field X, etc.) will not be displayed here.
Performance Logs are the core logs that PowerScribe creates when the performance option is selected in the Enable Logging preference.
The time of the event
There are several tasks that may be listed:
| Task | Description |
| Launch | This is the time to start the PowerScribe client to the time “Loading system components” completes and the login can begin |
| SpeakerChangedEvent | Logged to show how long it takes to download the updated speech profile |
| Login | This is logged for users logging into the client |
| QuickSearch | When the search drop down is set for Multi-Accession |
| QuickSearchByAccession | When the search drop down is set for single accession |
| OpenReport | When a report is opened from the results on the Explorer Screen |
| MyReports | When a user browses MyReports |
| Worklist | When a user searches a Worklist |
| Browse | When a user uses the search function |
| SaveAsWetRead | When a user saves a report as wet read |
| CorrectReport | When a user sends a report to editor |
| SignReport | When a user signs a report |
| PreliminarySign | When a user, resident or attending, prelims a report |
| Overread | When a user marks a report for overread |
The amount of time for the specific event
The amount of time a user was presented with dialog boxes
PLEASE NOTE: These times may not be accurate in 3.5 and lower for report close events. Refer to the other, more specific tabs for more accurate times.
The amount of relevant AutoTexts for that report.
Sign password change interval, for customers who require a user to input their password after X amount of report signs.
The amount of time to initialize Dragon on the workstation.
The amount of time to download the user’s speech profile.
The amount of time to select the appropriate dictation source for the user.
RAS logs measure the time it takes for the client to initiate the web request to the server and the client to receive the response back from the server. This time covers the network travel time, as well as any server-side processing/database updates.
To identify poorly performing web requests, you would sort by the TimeTaken column. If you do identify an issue here, the next step would be troubleshooting either the network or servers.
The MethodCall column contains the specific request the client is making of the server. Not all of these requests cause client side delays (as some, like Authentication.KeepAlive) run in the background on a timer.
This column has too many potential methods to list them all, but reading the name will give you an indication of what it’s doing.
Quality check is initiated by the client but the requests to the Nuance NUS systems are made by the RAS process on the app server. This data ALSO appears under the RAS tab, but in an effort to make things more clear, this tab breaks out those specific calls.
To identify poorly performing quality check events, sort by the TimeTaken column.
The recognition events tab pulls data from the Dragon log to show how long and what text Dragon has recognized.
The TotalTime column shows you the largest time spent recognizing a single utterance. Note however, that the time taken is relative to the amount of text.
Background noise can significantly increase the amount of time it takes to recognize a single utterance. Dragon will wait for an utterance to complete before it will perform the recognition. Utterances are spaced apart by breaks in the audio input. If background noise or signal input is constant, then the user may experience delays in text appearing on screen.
![]()
When Dragon is listening and determines the input is noise (and not any text), you will see …Utterance rejected… as the recognized text.
If a user has issues with noise/background noise, try the following:
If the logs indicate there is an issue with noise, you can have the user use the Report Dictation problem function to obtain a DRA file you can then playback.
The profile management tab tracks the local Dragon profile size for the user, whether any trimming was necessary, and how long that process takes.
The TimeTaken column will show you any latency with this process.
When the DRA file is generated (see Audio Generation > Types of Audio > Optimization for more details about this process).
The size of the local profile
Profiles have a maximum local size of 160 MB. If the profile goes over that, the older DRA file is deleted. If it’s under that size, the files remain.
The time it took to maintain the local profile size.
On report open, the available trigger words for voice invoking AutoTexts can change. This is based on relevancy and site, as well as whether the user has the Voice Invoke all Default AutoText preference set to true. As reports are open and closed, these trigger words are added and removed. This tab shows this process and how long each of these events takes.
To determine if there is a problematic AutoText, sort by the TimeTaken column.
Missing content
This tab identified the AutoText trigger word (Trigger Word column) on each login (with a new row for each login), counts how often it’s used to invoke an AutoText (Successful Invokes column), how many times in recognized as plain text (Failed Invokes column), and how many times Dragon determines input to be background noise (Total Rejections column).
This tab is helpful for understanding when a user is having issues invoking AutoTexts, but it can’t determine if the Trigger Word is being recognized as a DIFFERENT word (IE, Macro recognized as Acral). To make those determinations needs to be a manual process.
The report open times tab contains all report open events from within the client. There are several ways in which a report can be opened and initiated, which change the invoked from and task, but this tab always revolves around report open.
To identify long report opens, you would sort by the TimeTaken column.
The time of the report open event.
The task column changes based on how the report is searched or potentially opened. If the search drop down is set for SingleAccession in the client, the task will be QuickSearchByAccession. If the accession searched is MultiAccession, then the task is QuickSearch, and if the user manually opens a report from the search grid, the task is OpenReport.
The amount of time taken to complete the report open.
This column notes how long it takes to add the AutoText names to Dragon so they can be voice invoked. It is part of the overall TimeTaken column value. The amount of AutoTexts loaded correlates to the Normals column count.
Review the AutoText Trigger Load tab to determine if there is a specific AutoText causing this time to be high. If not, you will want to ensure the customer has the proper anti-virus exclusions in place.
Is the TimeTaken column minus the AddNormalsTime column.
See Performance Tab.
This indicates whether the user was recognizing text when the report was opened, which can delay integrations.
The amount of relevant AutoText for this report.
Large amounts of AutoTexts being loaded into Dragon at report open will negatively affect report opens, typically on the first report open of the session. However, if this is a frequent issue, consider AV as a culprit.
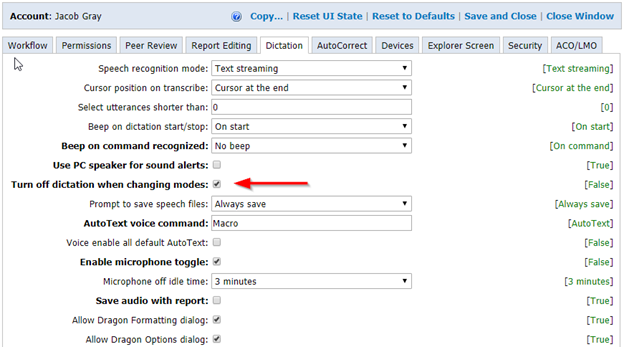
If the user has the “IsDictating” marked as true and are using toggle dictation on/off for their PowerMic dictation button setting, consider having the user enable the “Turn off dictation when changing modes” preference. This will turn the user’s microphone when they close a report and eliminate audio being recognized on report open.
If the time taken is large, but the AddNormalsTime column has a low value, review the RAS logs tab during the report open time period.
If those things check out, review the Recognition Events tab to be sure there wasn’t any audio being recognized.
The sign times tab contains data generated when an attending user goes to sign a report as final. During that process, several things happen. Users are prompted for various dialog boxes, up to two different types of audio are generated.
When users have Enable Background Report Saving enabled, this will be the time until the report is closed, and they are returned to the Explorer Screen (and will fire the first of two report closed integration events with a report status of pending). Because of this, you should review the RAS tab in concert with this tab.
To look for long report signs, review the MinusDialog column, along with the RAS logs tab.
This is the time the user initiated the report sign
In versions before 4.0, the dialog time on the performance tab was NOT accurate. This timestamp looks at the difference between when the sign is started by the user and when the internal process begins, the difference being how long the user was prompted for dialog boxes.
See Audio Generation tab
See Audio Generation tab.
The total time on the sign including dialog boxes.
The time spent by PowerScribe on the sign process. This is the column to sort by when looking for long report signs.
Again, the Enable Background Report Saving preference can cause the times that appear here to not reflect the end user experience. Review the RAS and Audio Generation tabs for assistance determining next steps.
This tab can demonstrate how long it takes for a user to press the microphone button to start recording before the microphone turns on and is ready for the user to start dictation.
Review the TimeTaken column to find latencies turning on the microphone.
This is the timestamp for when a user pressed the dictate button on the microphone down
This is the timestamp for when Dragon logs a turning microphone on event.
This is the time delta between the first two columns. This is the column to sort by when looking for microphone on latency.
This tab relies on a user to press the microphone button to start dictation. This works for users in dead man but could be less reliable for users using toggle on off.
Users using headsets and voice commands to start and stop dictation wouldn’t show on here. For those users, refer to the recognition tab.
Each line in the batch read tab demonstrates the time it takes from report close to report open, and how much of that time is taken by PowerScribe.
![]()
The first column is when the user initiates the close event within the report. This would be the mic button press, the GUI button press, or the recognition event.
The second column is when the integration event (either via API or XML file drop) is sent to PACS/Workflow Orchestration notifying the application that the current report has been closed.
PLEASE NOTE: If the user has Enable Background Report Saving enabled in their preferences, there are actually TWO events that fire at report close. One has a report status of pending, and the other has the actual report status. This timestamp is always the second of these two events.
This is simply the accession that was closed by PowerScribe.
This column is when the next report open command is received by PowerScribe.
This column is when the report is open and ready to dictate.
This is simply the accession that was opened by PowerScribe.
This is how much time was consumed by the PowerScribe process for both the report close and report open, indicating how long the user was waiting on PowerScribe.
This is how much time was spent between the report close and report open in total. This would include any time the user spends looking at images before initiating a reporting event (when the user isn’t in batch read mode)
This tab can be useful for demonstrating how long the user is waiting on PowerScribe to complete its actions so the user can work. However, we cannot truly determine whether a user was in batch read mode. This tab is only useful when you know a user is using batch read from the application driving the workflow.